慢查询日志简介
慢查询日志是MySQL提供的一种日志记录形式,由SQL语句组成。用来记录在MySQL中响应时间超过阈值的语句,具体指运行时间超过long_query_time值的SQL,则会被记录到慢查询日志中。慢查询日志可用于查找执行时间较长的查询,因此可作为优化的候选对象。long_query_time的默认值为10,指运行10s以上的语句。
1 | 注意: |
慢查询相关参数
这里列出5.7版本中与慢查询相关的参数和描述,参考官网
系统变量 及命令行格式 |
作用域及动态设置 |
取值及默认值 |
描述 |
|---|---|---|---|
| slow_query_log –slow-query-log[={OFF/ON}] |
全局 YES |
OFF/ON OFF |
是否启用慢查询日志 |
| long_query_time –long-query-time=# |
全局/会话 Yes |
[0-xxx] 10 |
慢查询时间阈值 |
| min_examined_row_limit –min-examined-row-limit=# |
全局/会话 Yes |
[0-xxx] 0 |
扫描行数少于此值不会记录慢查询日志 |
| log_slow_admin_statements –log-slow-admin-statements[={OFF/ON}] |
全局 Yes |
OFF/ON OFF |
是否记录管理语句,包括 ALTER TABLE, ANALYZE TABLE, CHECK TABLE, CREATE INDEX, DROP INDEX, OPTIMIZE TABLE, and REPAIR TABLE. |
| log_queries_not_using_indexes –log-queries-not-using-indexes[={OFF/ON}] |
全局 Yes |
OFF/ON 0 |
未使用索引的语句是否记录到慢查询日志 |
| log_throttle_queries_not_using_indexes –log-throttle-queries-not-using-indexes=# |
全局 Yes |
[0-xxx] 0 |
当log_queries_not_using_indexes开启,此参数用来限制每分钟记录到慢查询日志的数量 |
| log_output –log-output=name |
全局 Yes |
TABLE/FILE/NONE FILE |
记录general_log和slow.log的日志存储方式 |
| slow_query_log_file –slow-query-log-file=file_name |
全局 Yes |
string hostname-slow.log |
慢查询日志文件的名称 |
| - –log-short-format[={OFF/ON}] |
全局 - |
OFF/ON OFF |
慢查询日志记录更少的信息 |
| log_slow_slave_statements –log-slow-slave-statements[={OFF/ON}] |
全局 YES |
OFF/ON OFF |
作为从库时生效,从库复制中如何有慢sql也将被记录,当binlog格式为的ROW时不生效。并且设置此值不会立即生效,变量的状态应用于所有后续的START SLAVE语句。 |
慢查询日志内容
1 |
|
慢查询参数控制顺序
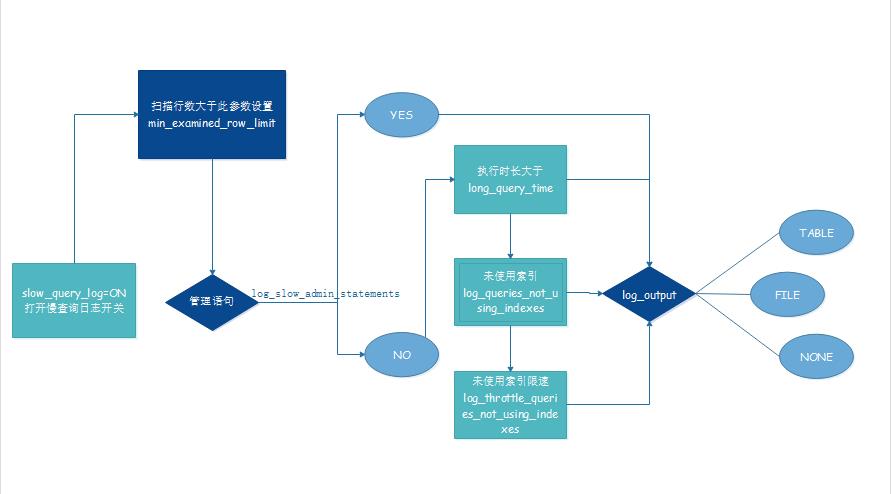
管理语句
- 开启慢查询:slow_query_log=ON
- 开启管理语句记录:log_slow_admin_statements = ON
- 关闭未使用索引的记录:log_queries_not_using_indexes=OFF
- 关闭从库同步过来是否记录:log_slow_slave_statements=OFF
- 设置min_examined_row_limit:10000
设置慢查询阈值:0.5s
1
2
3
4
5
6
7
8
9
10
11
12
13
14
15
16
17
18
19
20
21
22
23
24
25
26
27
28
29
30
31
32
33
34
35
36
37
38
39
40
41
42
43
44
45[root@localhost][test][02:21:36]> set global log_slow_admin_statements = ON;
Query OK, 0 rows affected (0.00 sec)
[root@localhost][test][02:21:57]> set global log_queries_not_using_indexes = OFF;
Query OK, 0 rows affected (0.00 sec)
[root@localhost][test][02:22:03]> set global log_slow_slave_statements = OFF;
Query OK, 0 rows affected (0.00 sec)
[root@localhost][test][02:22:08]> set global min_examined_row_limit = 10000;
Query OK, 0 rows affected (0.00 sec)
[root@localhost][test][02:22:14]> set global long_query_time = 0.5;
Query OK, 0 rows affected (0.00 sec)
[root@localhost][test][02:22:21]> set global slow_query_log_file = 'slow0001.log';
Query OK, 0 rows affected (0.00 sec)
[root@localhost][test][02:22:32]> select * from performance_schema.global_variables where variable_name in ('slow_query_log','long_query_time','min_examined_row_limit','log_slow_admin_statements','log_queries_not_using_indexes','log_throttle_queries_not_using_indexes','log_output','slow_query_log_file','log_slow_slave_statements');
+----------------------------------------+----------------+
| VARIABLE_NAME | VARIABLE_VALUE |
+----------------------------------------+----------------+
| log_output | FILE |
| log_queries_not_using_indexes | OFF |
| log_slow_admin_statements | ON |
| log_slow_slave_statements | OFF |
| log_throttle_queries_not_using_indexes | 10 |
| long_query_time | 0.500000 |
| min_examined_row_limit | 10000 |
| slow_query_log | ON |
| slow_query_log_file | slow0001.log |
+----------------------------------------+----------------+
9 rows in set (0.00 sec)
# 退出下session,重新建立
[root@localhost][test][02:22:51]> alter table employee1 engine = innodb;
Query OK, 0 rows affected (1.00 sec)
Records: 0 Duplicates: 0 Warnings: 0
# 查看slow.log
Tcp port: 3306 Unix socket: /opt/mysql3306/data/mysql.sock
Time Id Command Argument
# 此时慢查询日志没有记录alter table employee1 engine = innodb;在以上参数基础上,设置min_examined_row_limit为0
1
2
3
4
5
6
7
8
9
10
11
12
13
14
15
16
17
18
19
20
21
22
23
24
25
26
27
28[root@localhost][test][02:22:58]> set session min_examined_row_limit = 0;
Query OK, 0 rows affected (0.00 sec)
[root@localhost][test][02:24:32]> alter table employee1 engine = innodb;
Query OK, 0 rows affected (1.09 sec)
Records: 0 Duplicates: 0 Warnings: 0
[root@localhost][test][02:25:22]> alter table employee1 modify employeeid int(10) unsigned NOT NULL COMMENT '0',algorithm=copy;
Query OK, 9999 rows affected, 1 warning (0.94 sec)
Records: 9999 Duplicates: 0 Warnings: 1
# 查看slow.log
Tcp port: 3306 Unix socket: /opt/mysql3306/data/mysql.sock
Time Id Command Argument
# Time: 2020-06-03T14:24:35.704816+08:00
# User@Host: root[root] @ localhost [] Id: 15
# Query_time: 1.089764 Lock_time: 0.000209 Rows_sent: 0 Rows_examined: 0
use test;
SET timestamp=1591165474;
alter table employee1 engine = innodb;
# Time: 2020-06-03T14:25:50.639222+08:00
# User@Host: root[root] @ localhost [] Id: 21
# Query_time: 0.939964 Lock_time: 0.000218 Rows_sent: 0 Rows_examined: 0
SET timestamp=1591165549;
alter table employee1 modify employeeid int(10) unsigned NOT NULL COMMENT '0',algorithm=copy;
# 02:22:58 设置的min_examined_row_limit为0
# 02:24:32 再次执行的alter,记录到了slow.log
总结:
慢查询管理语句的记录受参数log_slow_admin_statements、min_examined_row_limit的影响,并不受long_query_time影响。
alter table … ,algorithm=copy;时执行完成显示Query OK, 9999 rows affected,实际慢查询记录的Rows_sent、Rows_examined全是0
查询语句(利用索引)
- 开启慢查询:slow_query_log=ON
- 开启管理语句记录:log_slow_admin_statements = OFF
- 关闭未使用索引的记录:log_queries_not_using_indexes=OFF
- 关闭从库同步过来是否记录:log_slow_slave_statements=OFF
- 设置min_examined_row_limit:10001
设置慢查询阈值:0.0000001s
1
2
3
4
5
6
7
8
9
10
11
12
13
14
15
16
17
18
19
20
21
22
23
24
25
26
27
28
29
30
31
32
33
34
35
36
37
38
39
40
41
42[root@localhost][test][03:14:29]> select * from performance_schema.global_variables where variable_name in ('slow_query_log','long_query_time','min_examined_row_limit','log_slow_admin_statements','log_queries_not_using_indexes','log_throttle_queries_not_using_indexes','log_output','slow_query_log_file','log_slow_slave_statements');
+----------------------------------------+----------------+
| VARIABLE_NAME | VARIABLE_VALUE |
+----------------------------------------+----------------+
| log_output | FILE |
| log_queries_not_using_indexes | OFF |
| log_slow_admin_statements | OFF |
| log_slow_slave_statements | OFF |
| log_throttle_queries_not_using_indexes | 10 |
| long_query_time | 0.500000 |
| min_examined_row_limit | 10000 |
| slow_query_log | ON |
| slow_query_log_file | slow0001.log |
+----------------------------------------+----------------+
9 rows in set (0.00 sec)
[root@localhost][test][03:14:31]> set session long_query_time = 0.0000001;
Query OK, 0 rows affected (0.00 sec)
[root@localhost][test][03:14:39]> set session min_examined_row_limit = 10001;
Query OK, 0 rows affected (0.00 sec)
[root@localhost][test][03:14:44]> explain select count(*) from employee1 where update_time > '20200501';
+----+-------------+-----------+--------------+-------+---------------+---------+---------+------+------+----------+--------------------------+
| id | select_type | table | partitions | type | possible_keys | key | key_len | ref | rows | filtered | Extra |
+----+-------------+-----------+--------------+-------+---------------+---------+---------+------+------+----------+--------------------------+
| 1 | SIMPLE | employee1 | P202005,PMAX | range | PRIMARY | PRIMARY | 5 | NULL | 4999 | 100.00 | Using where; Using index |
+----+-------------+-----------+--------------+-------+---------------+---------+---------+------+------+----------+--------------------------+
1 row in set, 1 warning (0.00 sec)
[root@localhost][test][03:14:48]> select count(*) from employee1 where update_time > '20200501';
+----------+
| count(*) |
+----------+
| 9999 |
+----------+
1 row in set (0.01 sec)
[root@localhost][test][03:14:53]>
# 查看slow log,此时并没有记录
# 由于select count(*) from employee1 where update_time > '20200501';扫描行数为4999,小于min_examined_row_limit设置的10001,并且执行时长是大于0.0000001s将min_examined_row_limit修改为3000
1
2
3
4
5
6
7
8
9
10
11
12
13
14
15
16
17
18
19
20
21[root@localhost][test][03:15:01]> set session min_examined_row_limit = 3000;
Query OK, 0 rows affected (0.00 sec)
[root@localhost][test][03:15:06]> select count(*) from employee1 where update_time > '20200501';
+----------+
| count(*) |
+----------+
| 9999 |
+----------+
1 row in set (0.00 sec)
[root@localhost][test][03:15:08]>
# 查看slow log
# Time: 2020-06-03T15:15:08.108595+08:00
# User@Host: root[root] @ localhost [] Id: 17
# Query_time: 0.002721 Lock_time: 0.000141 Rows_sent: 1 Rows_examined: 9999
SET timestamp=1591168508;
select count(*) from employee1 where update_time > '20200501';
# 此时语句记录到了slow log,select count(*) from employee1 where update_time > '20200501';扫描行数为4999,大于min_examined_row_limit设置的3000,并且执行时长是大于0.0000001s
总结:
查询语句(使用索引)的SQL,扫描行数大于min_examined_row_limit的前提下,执行时长如果大于long_query_time则会记录,小于则不会记录;
扫描行数小于min_examined_row_limit的前提下,执行时长的参数设置就不生效;
查询语句(不走索引)
- 开启慢查询:slow_query_log=ON
- 开启管理语句记录:log_slow_admin_statements = OFF
- 关闭未使用索引的记录:log_queries_not_using_indexes=ON
- 每分钟记录未索引的次数:log_throttle_queries_not_using_indexes=10
- 关闭从库同步过来是否记录:log_slow_slave_statements=OFF
- 设置min_examined_row_limit:10000
设置慢查询阈值:0.5s
1
2
3
4
5
6
7
8
9
10
11
12
13
14
15
16
17
18
19
20
21
22
23
24
25
26
27
28
29
30
31
32
33
34[root@localhost][test][03:31:11]> select * from performance_schema.global_variables where variable_name in ('slow_query_log','long_query_time','min_examined_row_limit','log_slow_admin_statements','log_queries_not_using_indexes','log_throttle_queries_not_using_indexes','log_output','slow_query_log_file','log_slow_slave_statements');
+----------------------------------------+----------------+
| VARIABLE_NAME | VARIABLE_VALUE |
+----------------------------------------+----------------+
| log_output | FILE |
| log_queries_not_using_indexes | ON |
| log_slow_admin_statements | OFF |
| log_slow_slave_statements | OFF |
| log_throttle_queries_not_using_indexes | 10 |
| long_query_time | 0.500000 |
| min_examined_row_limit | 10000 |
| slow_query_log | ON |
| slow_query_log_file | slow0001.log |
+----------------------------------------+----------------+
9 rows in set (0.00 sec)
[root@localhost][test][03:31:15]> select sleep(1);
+----------+
| sleep(1) |
+----------+
| 0 |
+----------+
1 row in set (1.00 sec)
[root@localhost][test][03:31:36]> select sleep(0.1);
+-------------+
| sleep(0.01) |
+-------------+
| 0 |
+-------------+
1 row in set (0.01 sec)
# 查看slow log,没有记录日志
# 由于select sleep(1);扫描行数为0,小于min_examined_row_limit的10000,不管sql执行时长有没有大于long_query_time都不会记录将min_examined_row_limit修改为0
1
2
3
4
5
6
7
8
9
10
11
12
13
14
15
16
17
18
19
20
21
22
23
24
25
26
27
28
29
30
31
32
33
34
35
36
37
38
39
40
41
42
43
44
45
46
47
48[root@localhost][test][03:31:31]> set session min_examined_row_limit = 0;
Query OK, 0 rows affected (0.00 sec)
[root@localhost][test][03:31:45]> select sleep(1);
+----------+
| sleep(1) |
+----------+
| 0 |
+----------+
1 row in set (1.00 sec)
[root@localhost][test][03:31:55]> select sleep(0.1);
+------------+
| sleep(0.1) |
+------------+
| 0 |
+------------+
1 row in set (0.10 sec)
[root@localhost][test][03:31:59]> select sleep(0.4);
+------------+
| sleep(0.4) |
+------------+
| 0 |
+------------+
1 row in set (0.40 sec)
[root@localhost][test][03:32:18]> select sleep(0.6);
+------------+
| sleep(0.6) |
+------------+
| 0 |
+------------+
1 row in set (0.60 sec)
# 查看slow log
# Time: 2020-06-03T15:31:55.890178+08:00
# User@Host: root[root] @ localhost [] Id: 19
# Query_time: 1.000207 Lock_time: 0.000000 Rows_sent: 1 Rows_examined: 1
SET timestamp=1591169514;
select sleep(1);
# Time: 2020-06-03T15:32:20.820796+08:00
# User@Host: root[root] @ localhost [] Id: 19
# Query_time: 0.600206 Lock_time: 0.000000 Rows_sent: 1 Rows_examined: 1
SET timestamp=1591169540;
select sleep(0.6);
# 此时select sleep(1);select sleep(0.6);记录到了慢查询日志,大于min_examined_row_limit的0,满足了long_query_time会记录,不满足long_query_time不会记录
总结:
查询语句(不走索引)的SQL,扫描行数大于min_examined_row_limit的前提下,执行时长如果大于long_query_time则会记录,小于则不会记录;
扫描行数小于min_examined_row_limit的前提下,执行时长的参数设置就不生效;
其他参数
其他参数暂时未做测试
生产建议
1 | +----------------------------------------+----------------+ |
将log_queries_not_using_indexes设置为OFF的原因是,生产环境可能会有多套监控,当库中表或者其他对象过多时,监控的统计语句或者检索语句因大多从information_schema元数据库取数据,没有走索引,slow log可以会占比较多,会淹没正常的告警。生产的慢SQL完全依赖min_examined_row_limit和long_query_time及log_slow_admin_statements来控制,一类是DDL,别一类正常的DML。
慢查询日志分析工具
1.官方自带工具: mysqldumpslow
2.percona-toolkit工具包中的pt-query-digest
总结
MySQL日常运维工作中,慢查询日志的优化工作能占到日常工作的30%以上,因此对慢查询产生的时机,相关参数,输出内容要有清楚的认识,才能更好的去运维MySQL,最大化的优化慢查询语句,提高数据库服务的稳定性。


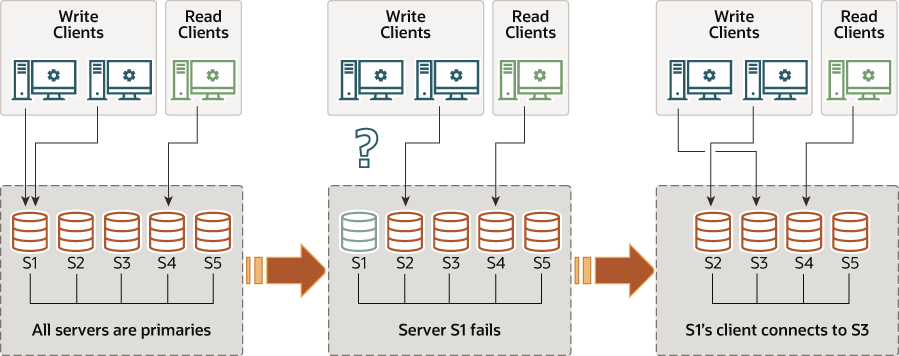
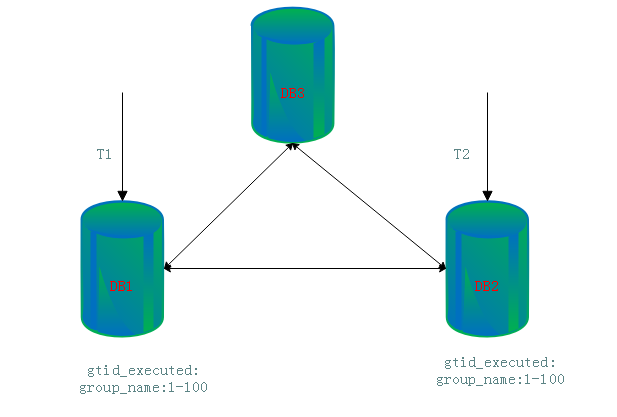
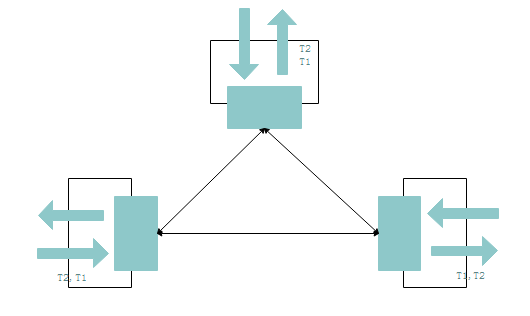
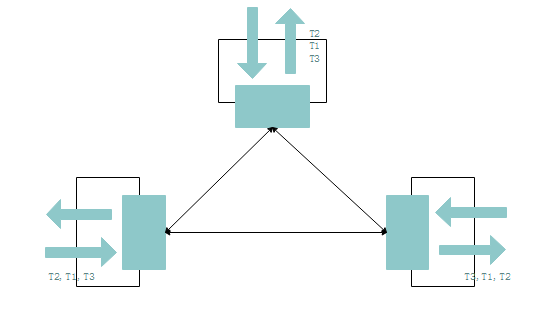
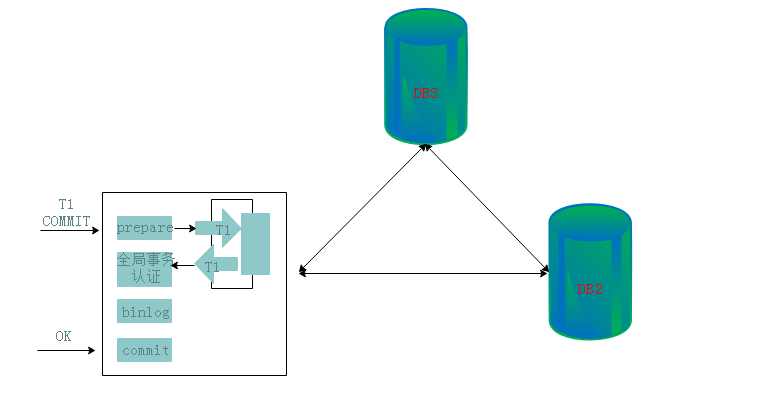
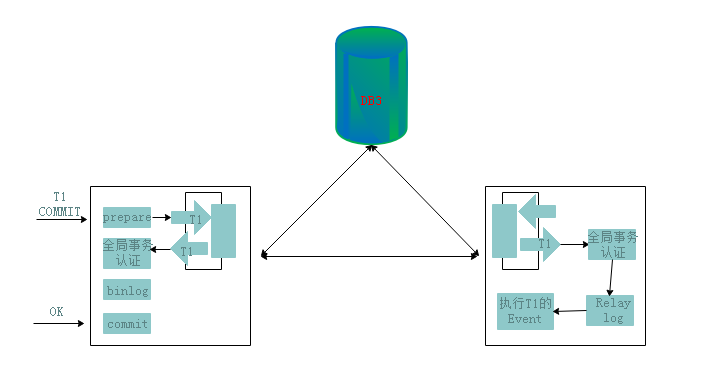
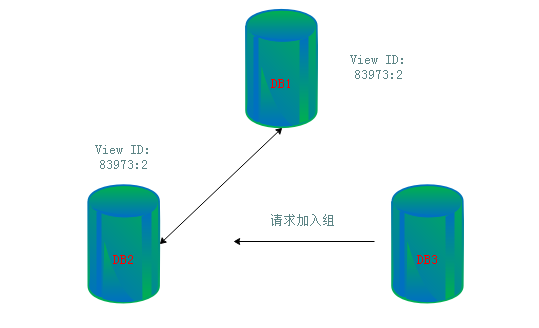
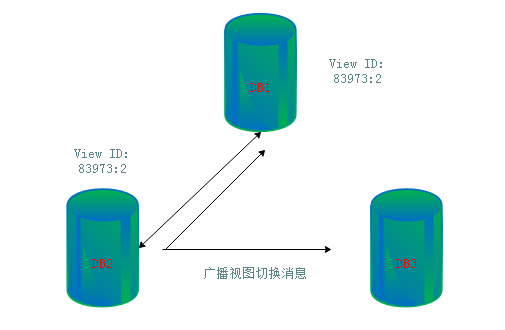
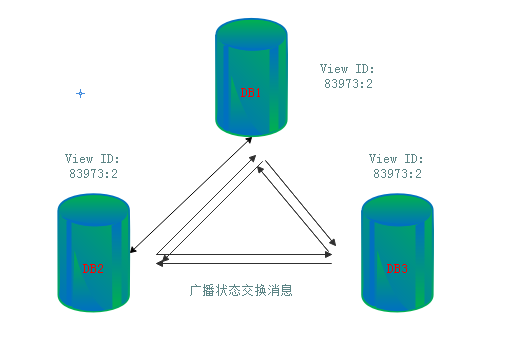
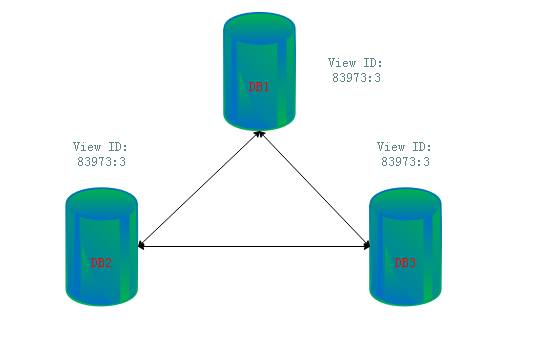
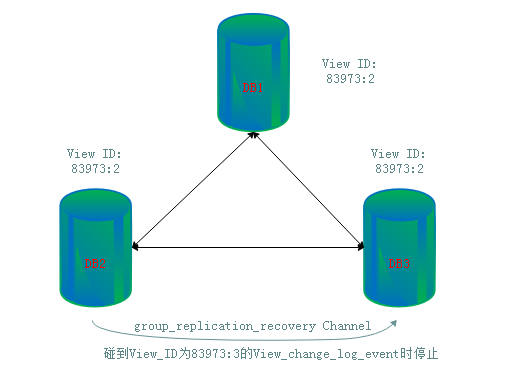
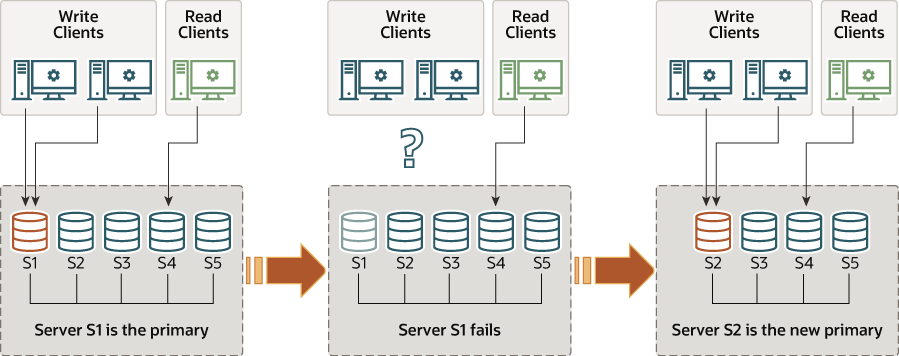 在单主机模式下,将禁用在多主机模式下部署的某些检查,因为系统会强制每次只有一个写入节点。例如,允许对具有级联外键的表进行更改,而在多主模式下不允许。在主节点故障时,自动选举机制选择下一个主节点。通过按字典顺序(使用其UUID)并选择列表中的第一个节点来排序剩余的节点来选择下一个主节点,可通过group_replication_member_weight此参数影响选主。如果主节点从组中删除,则执行选择,并从组中的其余节点中选择新的主节点,这个选择按照词典顺序排序节点UUID并选择第一个来执行。一旦选择了新的主节点,其他节点将设置为从节点,从节点为只读。